03/05/2026
Understanding the specific causes of port congestion in 2026 is critical for logistics leaders facing volatile transit times and escalating demurrage risks. As global trade moves beyond simple capacity issues to complex structural challenges, identifying these bottlenecks early allows businesses to pivot their routing strategies and protect profit margins before delays occur.
*2026 Logistics Outlook Key Takeaways: For supply chain decision-makers, the landscape of port delays has shifted from temporary disruptions to permanent structural friction. Here is the executive summary of what is driving congestion this year:
|
Port congestion is a logistical bottleneck where the volume of incoming cargo exceeds a terminal’s handling capacity, resulting in a significant reduction in throughput speed. Unlike simple traffic, congestion in 2026 is defined by a breakdown in terminal velocity, the rate at which a container moves from the vessel, through the yard, and out the gate.
From an operational standpoint, congestion occurs when three critical nodes fail simultaneously:
Anchorage Saturation: Vessels cannot berth immediately and must wait at sea, throwing off schedule reliability.
Yard Density: The terminal storage area reaches critical capacity often above 85%, making it impossible for cranes to efficiently locate and move specific containers.
Gate Gridlock: The interface between the port and the inland network (trucks and rail) becomes blocked, preventing imports from clearing the terminal.
Economic impact for businesses, port congestion is not just a time delay; it is a direct financial penalty. It triggers demurrage charges for cargo stuck in the port, detention fees for equipment held outside the port, and the forced use of expensive air freight to recover lost time.

|
While the visual of ships waiting at sea captures headlines, the real drivers of congestion in 2026 are often invisible structural failures. Based on current global supply chain data, here are the primary reasons for port delays this year.
Traditionally, Peak Season occurred strictly between August and October. However, in 2026, the calendar has fragmented due to defensive ordering.
Root Cause: Importers now front-load inventory months in advance to avoid feared tariffs or labor strikes. This creates artificial demand spikes that hit ports during what should be slack months.
2026 Update: Data shows that Q1 and Q2 volumes are abnormally high as businesses rush to beat potential mid-year regulatory changes.
Operational Impact: Terminals cannot predict labor requirements accurately. A sudden influx of cargo during a quiet month overwhelms the available workforce, leading to immediate yard gridlock.
Cost Implication: Shippers pay peak season surcharges year-round, and face increased storage fees as goods arrive before warehouses are ready to receive them.

Labor stability remains the single most volatile variable in port operations.
Root Cause: Disagreements between port unions (such as the ILA in the US or dockworkers in Northern Europe) and terminal operators regarding automation and wages lead to slowdowns or strikes.
2026 Update: With major multi-year contracts up for renewal this cycle, the threat of a strike is as damaging as the strike itself.
Operational Impact: When a strike looms at one coast (e.g., East Coast), shippers panic-route cargo to the opposite coast (West Coast). This sudden diversion overwhelms the alternate ports, creating congestion where none existed previously.
Cost Implication: Rerouting fees, higher spot rates for guaranteed slots, and the cost of holding inventory in transit for weeks longer than planned.
The chassis is the humble backbone of port fluidity. When they run out, the port effectively freezes.
Root Cause: A chassis (the trailer frame used to move containers) becomes unavailable when it is stuck under a container that hasn't been unloaded at a destination warehouse.
2026 Update: Street dwell time has spiked. Because warehouses are full, containers sit on chassis in parking lots for 8–10 days instead of the usual 3.
Operational Impact: Without a free chassis, truckers cannot pick up new import boxes from the port. These imports stack up in the terminal yard, choking off space for the next ship to unload.
Cost Implication: Daily chassis rental fees accumulate, and containers left at the port incur punitive demurrage charges because they physically cannot be moved.

Carriers are deploying larger ships to achieve economies of scale, but ports are struggling to digest the volume.
Root Cause: Ultra-large container vessels (ULCVs) exceeding 24,000 TEUs dump massive amounts of cargo at once, rather than smaller amounts spread over the week.
2026 Update: A wave of new vessel deliveries has entered the Asia-Europe and Trans-Pacific trades.
Operational Impact: These cargo pulses overwhelm terminal resources. It takes longer to work a single ship, meaning the berth is occupied for days. Meanwhile, the yard is flooded with thousands of containers instantly, causing a temporary paralysis of landside operations.
Cost Implication: Extended lead times for goods availability and increased rolled cargo risks for exports waiting to load.

Port congestion often starts miles away from the water at the distribution center.
Root Cause: When consumer demand slows or inventory planning fails, warehouses fill up.
2026 Update: High interest rates have forced companies to hold leaner inventories, but the safety stock ordered during previous disruptions is still clogging the system.
Operational Impact: If a warehouse is full, it cannot accept new deliveries. The trucker misses their appointment, and the container stays at the port. The terminal becomes a storage facility rather than a transit point.
Cost Implication: Massive storage fees and the bullwhip cost of having capital tied up in unsellable inventory sitting in marine containers.

While physical bottlenecks are visible, administrative congestion is a rising threat in 2026 due to stricter environmental regulations.
Root Cause: Incomplete or inaccurate paperwork regarding cargo classification, valuation, or new sustainability declarations prevents containers from being released.
2026 Update: The enforcement of global carbon pricing mechanisms (like the EU ETS) and stricter supply chain transparency laws means cargo lacking green documentation is flagged immediately.
Operational Impact: A customs hold freezes the container in the terminal stack. It cannot be moved, forcing cranes to work around it, which reduces overall yard efficiency.
Cost Implication: Daily storage fees accrue immediately, and non-compliance penalties often exceed the value of the freight itself.
Climate change has moved from a theoretical risk to a direct operational disruptor, altering transit times without warning.
Root Cause: Severe weather events, from hurricanes in the Gulf Coast to typhoons in the South China Seaforce ports to close entirely for days at a time.
2026 Update: Persistent drought conditions affecting canal drafts (such as the Panama Canal restrictions) are limiting the weight and number of vessels that can pass, forcing rerouting to longer ocean paths.
Operational Impact: The slingshot effect. When a port reopens after a 3-day storm closure, three days' worth of vessels arrive simultaneously with the scheduled arrivals. The terminal is instantly overwhelmed, creating a backlog that takes weeks to clear.
Cost Implication: unpredictable transit times destroy Just-in-Time inventory models, leading to stockouts or expensive emergency air freight to bridge the gap.

A port is only as fast as its gate. If there are no drivers to pull containers out, the marine terminal becomes a parking lot.
Root Cause: An aging workforce demographic combined with regulatory hurdles (such as stricter independent contractor laws) has created a structural deficit in drayage capacity.
2026 Update: The gap between retiring drivers and new entrants has widened. Furthermore, the fragmentation of chassis availability means drivers spend more time waiting for equipment than driving.
Operational Impact: Import containers dwell at the terminal past their free time simply because no power units are available to move them. This dwell reduces the space available to unload the next ship.
Cost Implication: High waiting time fees from trucking companies and escalating detention charges from ocean carriers.

There is a widening mismatch between modern vessel technology and legacy port capabilities.
Root Cause: While ocean carriers launch massive, high-tech vessels, many ports in North America and developing regions rely on infrastructure built decades ago.
2026 Update: The new class of 24,000+ TEU ships requires taller ship-to-shore cranes and deeper drafts that many secondary ports do not possess.
Operational Impact: Slower crane moves per hour. A mega-ship that should be unloaded in 3 days takes 5, occupying the berth and preventing other ships from docking.
Cost Implication: Reduced berth turnover leads to Port Congestion Surcharges passed on to the shipper to cover the inefficiency.

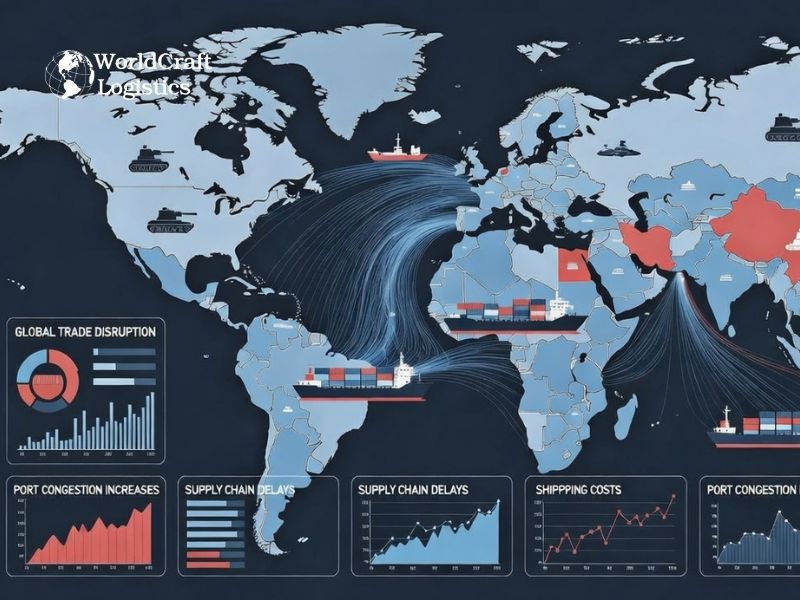
Global conflict is now a permanent variable in supply chain planning, removing the certainty of shortest distance shipping.
Root Cause: Regional conflicts (specifically ongoing disruptions in the Red Sea and Gulf of Aden) force vessels to avoid primary trade arteries like the Suez Canal.
2026 Update: The detour around the Cape of Good Hope is now the standard operating procedure for many alliances. This adds 10–14 days to the loop, absorbing global capacity.
Operational Impact: Vessel Bunching. Because ships are off-schedule, they arrive at destination ports in irregular clumps rather than evenly spaced intervals, causing sudden, unmanageable spikes in volume.
Cost Implication: Volatile ocean freight rates and the need to carry higher safety stock to buffer against the longer, less predictable lead times.
For supply chain directors, port congestion is not merely an operational headache; it is a direct line-item expense that erodes profit margins. In 2026, the financial penalties for stalled cargo have intensified as carriers and terminals enforce stricter dwell time policies to keep yards fluid.
The cost of delay typically falls into four compounding categories:
Demurrage (The Inside Cost): This fee is charged when a container remains inside the terminal after its allotted free time (usually 4–7 days) expires. With high yard density, terminals are aggressive about clearing space. Demurrage rates escalate daily, often doubling after the first tier of expirations.
Detention (The Outside Cost): This fee applies when the importer holds the carrier’s equipment outside the port longer than the agreed free time. Due to chassis shortages and warehouse bottlenecks, detention is the most common hidden cost for importers unable to return empty containers quickly.
Storage & Chassis Fees: Beyond carrier fees, third-party logistics costs accrue. If a trucker cannot deliver a box, it may sit in a temporary storage yard, incurring daily storage and chassis rental fees that are separate from demurrage.
Lost Sales & Contract Penalties: The most severe cost is the inability to fulfill customer orders. Retailers facing out of stock scenarios may face chargebacks from major vendors or permanent loss of shelf space.
While no single company can fix global infrastructure, agile shippers can mitigate the impact of port congestion through strategic adaptability. In 2026, the most successful logistics teams are moving from just-in-time models to just-in-case resilience.

Here are five proven strategies to minimize exposure to shipping delays:
Stop relying on a single gateway. If your distribution center is in the Midwest, do not route 100% of your volume through Los Angeles or Long Beach.
Allocate volume across the West Coast, Pacific Northwest (Seattle and Tacoma), East Coast (New York and New Jersey), and Gulf Coast (Houston). This diversification prevents total paralysis if one region faces a labor strike or weather event.
You cannot fix what you cannot see. Modern supply chains require granular tracking beyond the estimated time of arrival. Partner with forwarders who use predictive analytics to flag at-risk vessels before they depart. Worldcraft Logistics utilizes advanced tracking to identify congestion hotspots early, allowing you to re-route cargo to less congested ports while the manufacturing is still in progress.
When rail ramps are clogged, waiting for the train is a losing strategy. Terminate the ocean move at the port. Transload the cargo from the 40-foot ocean container into a domestic 53-foot trailer or team-driver truck. This bypasses the rail bottleneck and gets goods to the warehouse days faster.
The era of ultra-lean inventory is paused. Increase safety stock levels for critical SKUs. Front-loading orders during slack months, such as the first quarter, creates a buffer against the inevitable third-quarter peak season surges.
Air freight is expensive, but a factory shutdown is costlier. Do not air freight everything. Use a sea-air hybrid model. Move the bulk of goods via ocean, but fly key components or launch quantity stock to keep production lines running while the rest of the inventory navigates the ocean delay.
PORT NAME | LOCATION | PRIMARY CAUSE OF CONGESTION | SUPPLY CHAIN IMPACT | CURRENT AVERAGE WAIT TIME |
Port of Los Angeles | USA | High cargo volumes & workforce limitations. | Delays in unloading, increased storage fees, & rerouting needs. | 2.5–3 days |
Port of Long Beach | USA | Freight surges linked to LA bottlenecks & labor constraints. | Rising demurrage & detention costs; significant shipper disruption. | ~3 days |
Port of Shanghai | China | High export demand & infrastructure challenges. | Prolonged transit times for global shipments; higher shipping costs. | 0.8 days (+77% MoM) |
Port of Ningbo-Zhoushan | China | Systemic capacity constraints & volume spikes. | Delays to Europe/Americas; added logistical complexity. | 0.4 days (+70% MoM) |
Port of Antwerp | Belgium | Surge in container volumes & regional trade growth. | Higher storage costs & extended lead times for European trade. | 0.4 days (+117% MoM) |
Port of Vancouver | Canada | Labor strikes & insufficient terminal capacity. | Severe delays, cargo rerouting, & higher inland transport costs. | 1.4 days (+306% YoY) |
Port of Savannah | USA | Rising container traffic & operational inefficiencies. | Delayed US East Coast shipments affecting retail & manufacturing. | 2.4 days (+16% MoM) |
Port of Durban | South Africa | Aging infrastructure & labor shortages. | Increased dwell times & added costs for African trade routes. | 2.3 days (-11% MoM) |
Port of Djibouti | East Africa | Increased trade activity near the Suez Canal. | Delays in regional cargo handling & transshipment activities. | 2.3 days (+373% MoM) |
Port of Manila | Philippines | Limited infrastructure & operational inefficiencies. | Delays in cargo handling & increased rerouting costs. | 2.0 days (+10% MoM) |
The primary drivers include geopolitical rerouting away from the Red Sea, carrier capacity management through blank sailings, and labor disputes at major hubs. Additionally, the deployment of mega-vessels creates immediate volume spikes that overwhelm terminal chassis availability and yard space.
Congestion increases operational expenses through demurrage and detention fees, which accrue when containers sit too long at the terminal. It also triggers peak season surcharges and forces companies to use expensive air freight to recover lost time for critical inventory.
While extreme pandemic-level lockdowns have ended, congestion has shifted from a global crisis to a regional, rolling issue. Volatility is the new standard, meaning congestion will migrate between ports based on labor talks, weather events, and carrier schedule adjustments rather than disappearing entirely.
A blank sailing occurs when an ocean carrier cancels a scheduled voyage to manage capacity and stabilize freight rates. This reduces the available space for exports, forcing cargo to roll to the next vessel and creating an immediate backlog at the origin port.
Labor disputes slow down crane productivity and gate processing. Even the threat of a strike causes shippers to panic and reroute cargo to alternative ports, which instantly overwhelms those secondary locations and creates congestion where none existed before.
Demurrage is charged when a container stays inside the terminal after its free time expires. Detention is charged when an importer holds the container outside the port (at their warehouse) longer than the allowed free days. Both fees escalate daily and are major risks during congestion.
Businesses can minimize delays by diversifying their entry ports (using both East and West Coast gateways), increasing safety stock levels, and using transloading services to bypass clogged rail networks. Partnering with a proactive forwarder like Worldcraft Logistics helps identify these bottlenecks early.
Congestion hotspots in 2026 fluctuate rapidly. High-risk areas typically include the US West Coast during labor negotiations, major Asian export hubs like Shanghai and Ningbo before holidays, and European ports affected by Red Sea vessel bunching.
The continued avoidance of the Suez Canal forces vessels to sail around the Cape of Good Hope. This detour adds 10 to 14 days to transit times, absorbs global vessel capacity, and disrupts arrival schedules, leading to sudden cargo spikes at destination ports.
Ultra-large container vessels carry over 24,000 TEUs and discharge large volumes of cargo at once. This overwhelms the number of available chassis and cranes at the terminal, slowing down the unloading process and causing landside gridlock for days after the ship arrives.
If the logistics landscape of 2026 has taught us anything, it is that stability is no longer the default setting for global trade. The era of set it and forget it shipping is over. With port congestion now driven by a complex web of geopolitical shifts, labor volatility, and infrastructure gaps, the difference between a profitable quarter and a logistical disaster lies in adaptability.
You cannot control when a port strikes or when a vessel is rerouted, but you can control who manages your freight during the chaos.
You Say It, We Do It.
At Worldcraft Logistics, we engineer resilience into your supply chain. With over 15 years of experience spanning the USA, China, Vietnam, and Canada, we help businesses navigate the 2026 congestion crisis through:
Proactive Rerouting: Identifying bottlenecks early and shifting volume to fluid ports.
End-to-End Visibility: Real-time data for fact-based inventory decisions.
Customs Mastery: Flawless documentation to prevent costly delays.
Flexible Capacity: Expedited air freight and transloading options when you need them most.
Ready to congestion-proof your supply chain? Stop paying unnecessary demurrage fees. Contact our team today for a comprehensive route analysis.
🌐 Website: www.worldcraftlogistics.com
📧 Email: import@worldcraftlogistics.com
📞 Global HQ: (909) 632-1643

SEO
Digital Marketing/SEO Specialist
Simon Mang is an SEO and Digital Marketing expert at Wordcraft Logistics. With many years of experience in the field of digital marketing, he has shaped and built strategies to effectively promote Wordcraft Logistics' online presence. With a deep understanding of the logistics industry, I have shared more than 500 specialized articles on many different topics.

Hot News
08/05/2024
Hot News
02/23/2023
Hot News
02/23/2023
Hot News
02/06/2023

Hot News
02/07/2023