05/12/2023
Is it necessary to understand the Extended Supply Chains that your company has that are both upstream and downstream from its Tier 1 suppliers and clients? True is the response.
Situations at Tier 3 and Tier 4 suppliers as well as logistical services can frequently lead to supply chain disruptions. A lack of water in the Panama Canal system limits the number of ships that can pass through the locks; a drought in Spain limits the supply of vegetables to the UK; and record temperatures in Thailand force people to stay indoors, including those who work in export factories. Another factor for global corporations is sustainability requirements, which call for reports on a company's whole supply chain Core plus .
According to the supply data research company Resilinc, some of the greatest supply disruptions until 2022 happened as a result of firms running out of readily available, low-cost products or raw materials. Neon, coolant, paper, cotton, glass, and copper are a few examples of products made at the bottom tiers of the supply chain.
The Core and Extended supply chains must be considered while creating a Supply Markets Design Map. In the previous blog article, the relationship between the company and its Tier 1 suppliers' clients was examined. Discussed in this blog post are extended supply networks.
The procedure through which Procurement creates the Supply Markets Plan and contributes to the Supply Chains Design Map is shown in the diagram below. Category Management (Category Analysis, Spend Analysis, Spend-Risk Positioning), Supply Market Intelligence (SMI) Analysis, and Sourcing Plans are the first steps in this process.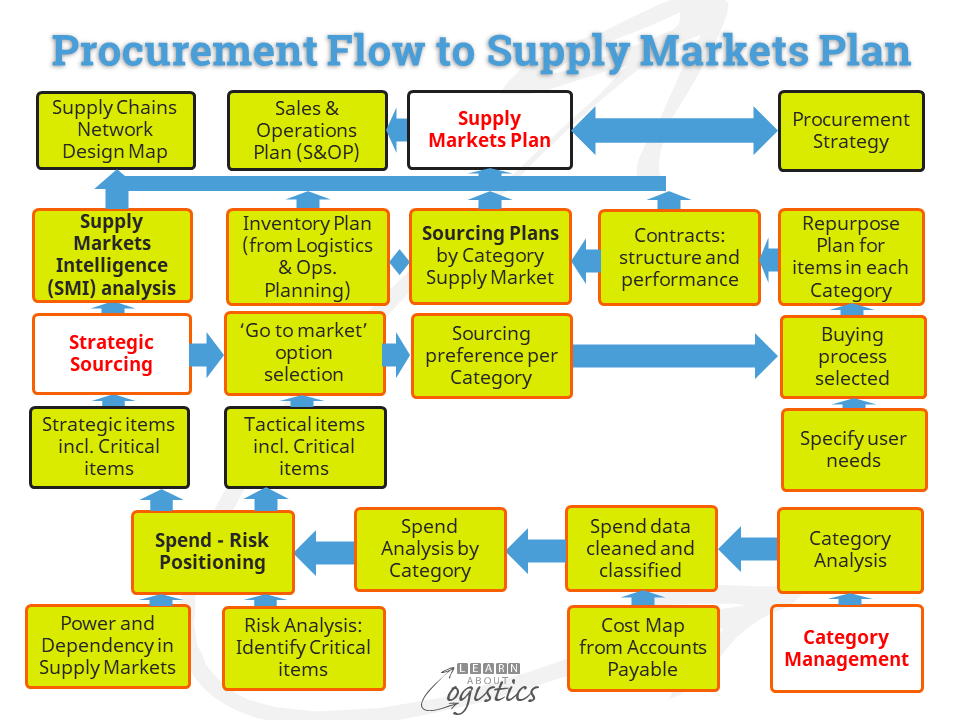
An organization's purchases are divided into "Supply industries groups" or "Process technology groups" according to category analysis. The items are classified by Category and sub-Category within each group:
For example, the supply industries group metals, packaging, and ingredients. As an illustration
The 'Ingredients' supply industry organization has that name.
'Sweeteners' is the name of one of this group's categories.
'Glucose' is the name of a sub-Category.
IT and telecoms, logistics services, travel and entertainment, marketing, and facilities are a few examples of the process technology category. As an illustration
'Facilities' is the name of a group for process technology.
'Industrial supplies' is the name of a Category under this heading.
'Safety glasses' is the name of a subcategory.
The categories and subcategories will change depending on what each organization needs. For example, a fluid transfer pump system will be categorised differently in the health and food industries than in the waste water maintenance industry.
Spend Analysis: By purchasing the same sort of product from multiple Tier 1 suppliers, your organization may believe that its supply risk has been decreased. However, where do the Tier 1 suppliers get their raw materials? And so on via the supplier Tiers. One or a small number of Tier 3 or Tier 4 suppliers may be the sole source of supply for all items in a subcategory.
Measures of criticality can be created at several levels, including the national (supply group; category), industry (supply group; category), and firm (category; sub-category).
How important is each category and subcategory to your company? Spending money with a supplier on an annual basis is not a reliable indicator of risk. Spend-Risk Positioning is where the process of identifying essential supply items begins. This allocates items to segments based on supply market risks using a percentage of the overall spend for each item, as indicated in the diagram below.
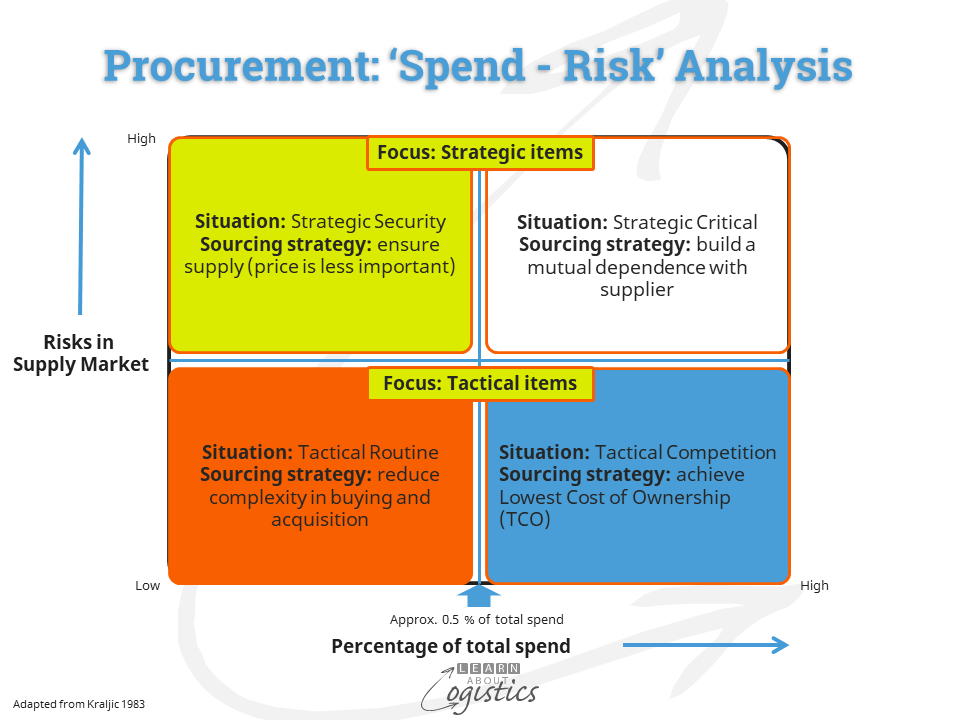
The items identified as Strategic are then analysed for Criticality, under six headings with examples:
Building models of your company's supply chain design map can help you grasp the dangers and available options, as David Cobby has pointed out in the 'Comments' area of our website. He uses the example of a dairy products company that, by modeling their supply chains and finding small changes to important components, was able to extend the effective shelf life of some goods by 20%.
Incorporating both the core and extended supply chains, the supply chains design map also highlights potential supply market concerns. With the finished Map, Category Managers can approach their Tier 1 suppliers with confidence to talk about the risks related to their Tier 1 suppliers' suppliers.
The construction of the Map seems to be a time- and money-intensive procedure. But how much might a sudden disruption cost your business? The "Revenue at Risk" measure is advised by Resilinc. Understanding and measuring the risks throughout your organization's complete supply chains is crucial given the various possibilities of global instability.
Content Creator

Hot News
08/05/2024

Hot News
02/23/2023
Hot News
02/23/2023

Hot News
02/06/2023

Hot News
02/07/2023