02/29/2024
Inadequate inventory forecasting can slowly and covertly erode your company's profits, reputation, and customer satisfaction over time. For this reason, any business owner must become proficient in the art of forecasting. Discover how to handle this frequently disregarded yet extremely difficult aspect of inventory management for any organization.

Demand planning, another name for inventory forecasting, is the process of estimating the amount of inventory that will be required for a future period based on historical data, current trends, and anticipated future occurrences. Precise prediction guarantees that companies have adequate inventory to satisfy client requests without squandering money on superfluous stock. Setting a reorder point is only one aspect of forecasting; another is employing data analysis to spot patterns and trends so that you can satisfy consumer demand and adjust to changing circumstances. While reorder points are a crucial component, inventory forecasting is significantly more complex.
See more:
👉 What is consignment inventory? Benefits and effective ways
👉 Mastering inventory management in supply chain knowledge to Success
👉 What is Digital Inventory & Why is it important with Ecommerce
A sales forecast examines the anticipated sales for a selected time frame, such as the upcoming 30 days.
The extra quantity of stock required to cover those sales is known as replenishment. Put differently, the forecasting of sales or customer demand plays a crucial role in informing decisions about replenishment. Typically, the replenishing procedure considers:
Taking into account the present stock levels: how much is there already? How much more merchandise is required?
Lead time from vendors: How long will it take for a product to arrive in inventory after a purchase order is placed with a supplier?
Stock on order is the amount of merchandise that you have already ordered from your supplier and is expected to arrive within the parameters you have set.
Returns from customers may result in an increase in your inventory level in the future. To help you choose wisely, you should consider these when making purchases.

Effective forecasting is based on data and formulae, although intuition and experience can help a little. These formulas can be approached and used in several ways.
The most popular formulaic approaches—trend, pictorial, qualitative, and quantitative—for accurate inventory forecasting are used. Select the optimal approach by considering known stocking problems, your own observations, sales feedback, customer feedback, statistical analysis, and market research.
👉 Forecasting trends: Trends are variations in a product's demand over time. Using historical sales and growth data, this technique anticipates potential patterns while removing seasonal impacts and inconsistencies. More detailed sales information supports this forecasting method by illustrating the probable future purchases of particular clients as well as customer types. This data can help analysts come up with fresh ideas for marketing and sales.
👉 Visual forecasting: Sales peaks and troughs can be displayed on a graph using the same data that a forecaster examines for trend forecasting. Because the graphical method is visual and provides insights, some forecasters find it more appealing. They can analyze potential directions that could otherwise go unnoticed by adding sloped trend lines to graphs and identifying patterns from a collection of data points.
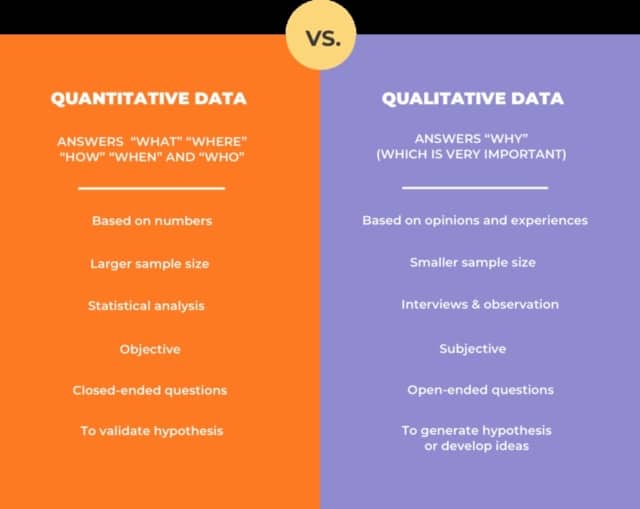
👉 Qualitative forecasting: Some businesses go directly to their clients for information in the absence of previous data. Market research and focus groups are two examples of the sophisticated data collection techniques used in qualitative forecasting. From this kind of data, forecasters then develop their models.
👉 Quantitative forecasting: Based on historical numerical data, quantitative forecasting is thought to be more accurate than qualitative study done alone. A company's projection is typically more accurate the more data it possesses. Time-series forecasting is one type of quantitative forecasting where a model is created to anticipate future trends based on temporal quantitative data.
For inventory forecasting, there are four fundamental methods you might take into account.
Trend forecasting: Use variations in your product's demand over time to project potential trends. Occasionally, seasonality or other anomalies in historical sales data are not taken into consideration.
Visual forecasting: By charting historical data, you can spot trends and add skewed trend lines to uncover potential insights that you might have overlooked otherwise.
Qualitative forecasting: Market research and focus groups are typically used in qualitative forecasting. From this kind of data, forecasters then develop their models.
Quantitative forecasting: This method predicts future demand by utilizing historical numerical data. The forecast is typically more accurate the more data that is collected.

Restocking is not the only aspect of forecasting. Planning when, what, and how much inventory should be reordered to meet demand comes after projecting future client need. These are but a few advantages of accurate inventory forecasting.
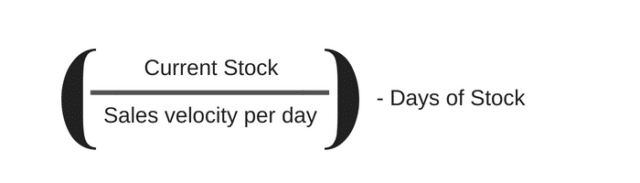
Do you have more inventory than you'll require for the ensuing thirty days? Alternatively, perhaps you're aware that you have too much and are unsure of the exact amount of overstock you own. The forecast can be used to determine the appropriate level of stock to have on hand.
First, figure out how many days' worth of inventory you wish to have on hand. The number of days you wish to have inventory stocked in your warehouse or store is known as days of stock. When calculating your days of stock, some things to take into account are:
Lead time: How long will it take for your supplier to send you products? You can also have fewer days of stock if your lead time is short. You will want longer days of stock, though, if it takes your vendor ninety days to deliver a fresh order. Days of stock roughly correspond to the frequency of orders that you will need to place. If it takes 90 days to reach you, you won't want to place an order every 14 days, which would leave you with several items in route.
How much does running out of stock cost? In other words, what is the cost to you of each lost sale? You might want to keep more stock on hand than if each stockout costs $100, if an average day without stock would cost you $10,000.
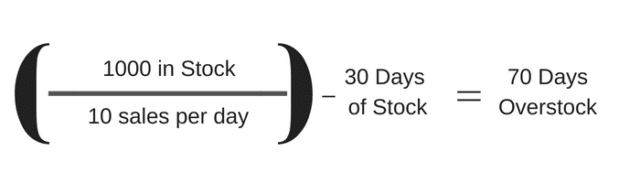
Multiply your daily sales velocity by the retail price of your goods to find the cost of a day's stock out. Divide your stock now by the daily sales velocity. You can calculate how many days you are short or overstocked by deducting that amount from your desired number of days of stock.
Say you have a thousand candy bars in stock. If you sell ten items a day, your inventory should be sufficient to cover thirty days' worth of sales.
Typical advice for sales forecasting is to "record every detail!"
In actuality, accurate demand forecasting minimizes the amount of data that must be manually entered.
Reordering, getting in touch with suppliers, updating inventory logs, and other tasks require a lot of time.
The amount of time spent on such tasks can be greatly decreased with effective demand forecasting.
For example, automating tasks like reordering is simple if you know ahead of time what you'll require. In a similar vein, you might not require a thorough stock check if you know what stock you're likely to have on hand at any one time. You should be able to determine whether or not your forecasts are accurate with a brief summary.
Time is saved greatly by all of this. Instead of laboriously entering data and taking inventory, your staff members may be working on more proficient tasks like customer service, sales, and marketing.

As mentioned before, brands have a propensity to aggressively market excess inventory. Brands act in this way for a good reason. Money is represented by inventory.
Selling your stock as quickly as feasible is the ideal scenario. There is an inherent urgency for perishables, but the idea holds true for all things. Over time, even the most storable objects will accumulate dust and sustain damage.
Unsold goods tie up a lot of cash and cost you money because they take up warehouse space.
You won't squander money on items that will just collect dust if your inventory forecasting is accurate. As a result, resources can be allocated to other lucrative endeavors.
If you do this correctly, your company's cash flow will be much healthier.
Quick decisions are crucial in the corporate world. You must make swift adjustments to your inventory planning and purchasing procedure, for example, if lead times lengthen, a certain supplier raises fees, or shipping containers become more costly.
Proper inventory forecasting allows you to quickly adapt to changes in the market by accounting for critical indicators like lead times, days of stock, seasonality, sales velocity, etc.

Here is the benefit of doing inventory forecasting correctly, now that you are aware of the drawbacks and the consequences of doing it incorrectly.
Although stock can be kept in large quantities in a warehouse and let to gather dust, this is typically not a viable method to conduct business. You will avoid needing to buy inventory that you won't need for a specific amount of time if you have data-driven projections about how much inventory you'll require. This implies that you can enhance the accounting for your goods, facilitate your cash flow, and even free up money for other company departments.
Having sufficient inventory on hand allows you to pick, pack, kit, and assemble each order as soon as it is placed, fulfilling your promise to clients about delivery times and stockouts. Inventory forecasting depends on marketing alignment on planned campaigns, even at the channel level.
Furthermore, when customers locate what they're looking for online and don't run into a "out-of-stock" warning that prompts them to purchase elsewhere, their overall experience is still pleasant. You run the danger of losing future business from every client you lose as a result of not having what they need when they need it.
Because accurate inventory forecasting can reduce some manual effort and better prepare you to address variations in demand, it reduces labor and warehousing costs. Inventory forecasting systems make it simple to anticipate future events and lower inventory carrying costs by automating reordering, estimating labor requirements, and accounting for variations in order volume. For warehouse management and all employees, this results in time and labor savings.
You can improve product management throughout the whole retail supply chain by using inventory forecasting. You can deal with your supplier more effectively and learn more about production cycles when you are aware of your manufacturer's lead times, your warehouse receiving timeframes, and the precise stock levels for each product for which you need to make a new buy order.
This way, when it looks like you're running low on inventory, you don't have to play the guessing game or just order more. You can decide with knowledge and do away with the necessity of rushing shipments and manufacturing deadlines.
Inventory that can no longer be sold is known as dead stock. This is usually because it is out of season, expired, or obsolete, all of which are results of inaccurate inventory forecasts.
One typical offense is to overorder goods in the first place, sometimes as a result of a manufacturer's excessive minimum order quantity. However, most frequently, it's an error in forecasting future demand or a complete absence of careful monitoring.
Naturally, not every SKU is made equal, or to put it another way, there might be big differences in demand for any product you offer. By working closely with sales and marketing teams to determine which products you want to retire or run a flash sale on, you can simplify your product line by making better decisions about the product life cycle based on your inventory's best-selling vs. slow-moving items.

Meeting customer demand is the ultimate objective of inventory forecasting, as we have already stated. So let's start by going over the demand prediction techniques. Subsequently, we will guide you through additional components and the necessary calculations to precisely schedule inventory purchases. Along with the best practices, we'll also expose you to several fantastic inventory forecasting tools.
Let us begin with the five most widely used techniques for inventory forecasting. These can be used separately or in combination for a more thorough outcome.
Forecasting trends entails projecting future demand fluctuations over a specified time frame. To do this, historical sales and growth data are analyzed, and patterns within the predicted period are sought after.
Depending on the situation, trend forecasting may be done in a top-down, bottom-up, or hybrid manner.
In top-down forecasting, items with high income are forecasted first and then lower. This is not the case with bottom-up forecasting.
Each has benefits and drawbacks. For instance, top-down forecasting provides you with an excellent overview of your best-selling items but leaves out a lot of specifics. On the other side, bottom-up forecasting allows you to be very particular but may omit more comprehensive information.
You may also concentrate on particular client trends. For instance, you may examine the sales trends of a certain consumer segment. This will assist you in forecasting their future purchasing patterns. You'll gain an idea of consumer purchasing patterns if you carry this out for each client segment.
This data can help you manage your inventories and prime your supply chain. Additionally, it helps in marketing and sales. For instance, your marketing teams can target their content towards customers in the 30–40 age range if your trend forecasting indicates that they frequently purchase a particular product.
However, trend forecasting isn't flawless. It doesn't account for sales irregularities, exogenous events, or seasonal influences. You'll have to experiment with alternative methods to include those.
Rather of being a "method" per se, graphical forecasting is more of a data presentation technique.
Creating graphs out of data—such as trend data—is the process of graphic forecasting.
This is well-liked by analysts since it makes identifying trends, patterns, and other ideas simple. People are primarily visual beings. When you see an upward trend on a graph rather than a sheet of data, it's quicker and simpler to comprehend that sales are increasing.
Although it can be difficult to gather qualitative data, it can be highly helpful.
You must visit the source if you want to collect qualitative data. This source can be your suppliers, customers, or both in the case of forecasting. Pose pertinent queries to them, then transform the responses into actionable information.
You may, for instance, inquire of your clients the following:
Which goods are your favorites?
Which goods do you purchase most frequently?
When is the best time of year for you to purchase X, Y, and Z?
Which of our product's features is your favorite?
How much time can you expect to wait for the delivery?
Focus groups are a useful tool for posing these queries. Qualitative data can also be obtained through surveys, feedback forms, and even comments made on social media. For instance, collecting qualitative information from customer evaluations is a common part of forecasting for Amazon sellers.
Qualitative research frequently yields very subtle data. Gathering and analyzing the data may take some time, but if you have enough, it will provide insightful information. After that, you can maximize your inventory by utilizing these insights.
Seasonal forecasting forecasts demand based on factors such as:
Tempestuous weather
Holidays (such as Christmas, Thanksgiving, and Easter)
Time-specific occurrences (like anniversaries or elections)
Seasons of sales (Winter, summer, or Black Friday sales, Cyber Monday sales)
Demand variations and seasonal shifts are common for most companies. For instance, a clothing store might sell more party apparel around Christmas and cozier products in the winter. Around Thanksgiving and Christmas, a grocery store can see a spike in sales, but after New Year's, when all those resolutions start to show, sales may decline.
Seasonal forecasting can greatly benefit from examining historical trends, both in the market as a whole and inside your own business. If you're projecting for an election year, for instance, consider the sales from the previous election. Did they rise, fell, or remained constant? Did any specific goods perform well? (Retailers of alcohol often notice an increase in sales during election seasons.)
Knowing your seasonal demands will help you with pricing and supply chain priming, among other things.

Start by thinking about the data you can already collect and the data you can obtain. Not every organization will follow the same procedure. Well-established businesses ought to apply the quantitative method, do inventory analysis, and begin with historical data. For startups, begin with gathering qualitative market data.
A variety of techniques and data formats are used in the best forecasts. For modelers, quantitative data provides a starting point. Including qualitative data gives the model more depth. To finish forecasting, use inputs unique to your industry.
Ensuring that the model accounts for wild cards, or rapidly fluctuating and frequently unpredictably occurring trends and market disruptions that have the potential to abruptly alter demand, is crucial. Certain market disruptions, like fads or stylistic shifts, happen gradually. Statisticians should create many models based on historical data and various possible scenarios when tackling more important difficulties, such a worldwide epidemic. They may even collaborate with scenario planning teams in this process.
To estimate potential demand, forecasters may also take into account situations with exceptional needs.

In order to help businesses balance having too much cash locked up in inventory with having enough goods to meet demand, inventory forecasting is used. The forecast period, base demand, and application of variables and trends are the three factors taken into account in this computation.
The further out a corporation goes for the projection period, the less accurate the prognosis becomes. Risk associated with science, market volatility, and current events are the causes of this uncertainty. The standard intervals are one year, ninety days, and thirty days. Seasonal variations are taken into consideration with a one-year forecast interval.
When starting a prediction, base demand refers to the known client requirement. Usually, it makes use of any presales or sales from the previous 30 days.
The trickier aspect of forecasting is using trends and variables. Certain analysts possess a formula for this; they might examine worldwide or even regional impacts and promotional campaigns. These consist of seasonality, supply chain difficulties, and sales velocity. Analysts must take into account the specific elements specific to each industry while planning for demand.
Four phases to inventory forecasting:
To forecast demand over the short and long terms, a number of interrelated factors must be considered, along with certain assumptions. Use the streamlined version of our inventory forecasting tutorial below to get started.
Note: This step-by-step approach walks through the components needed to reliably estimate inventory on a modest scale, but for ecommerce organizations that want to put something simple into practice, there are much more sophisticated statistical models and scientific procedures to construct.
The amount of time needed to calculate the precise inventory amounts you'll need to order is known as the forecast period. An annual view is useful to gain a feel of seasonality, but weekly, monthly, or quarterly views are also available.
It's time to study the data now that your timeline has been formed. To use the raw data as a benchmark:
Note any anomalies that don't pertain to the next demand period, such as when your business made a big announcement like a fundraising round or acquisition, or when it appeared on Shark Tank or Good Morning America and saw a sharp increase in orders right after the show.
Examine the promotions you ran and the seasonality.
Examine your geographical growth (e.g., note which nations you are receiving orders from abroad and whether these are organic).
Examine how this differed from previous times (for example, if you have been in business for a number of years and decide to use the entire calendar year as your timeline, you may want to look at the year before as well).

If you are satisfied with the baseline you obtained from the last period, make preparations for the future while anticipating and analyzing demand.
Examine future marketing strategies (promotions, announcements, new influencer efforts, etc.) and note how they differ and are similar from previous periods (e.g., Facebook ad performance being negatively impacted by recent iOS changes).
Include forecasts for any product modifications (new product launches, item retirements, limited drops that sell out and aren't replenished, etc.).
Examine market share, as well as the entrant and outgoing rivals, and the present business climate in the areas you serve (e.g., are lockdowns related to COVID-19 in effect, or are people returning to their pre-pandemic ways?).
Make a schedule for replenishing inventory, taking into account factors like manufacturer problems, supplier mix diversification, or additional lead times resulting from supply chain delays or congestion at ocean freight ports.
It's a good idea to budget for unforeseen expenses and include a contingency fund for unanticipated publicity, whether positive or negative; but, it's impossible to know exactly what will occur. It is advisable to execute multiple scenarios, including conservative, average, and aggressive results.
To continuously compare actual performance with the forecast, make adjustments to the forecast as you go. then recalculate if necessary. Keep marketing teams and inventory leads informed as predictions change. Of course, third parties like manufacturers, 3PLs, marketing agencies, and anybody else involved in your supply and demand channels should also be informed.
Make sure you set a reorder point for every SKU if you haven't already. First, consider:
To determine the reorder points for your products, sum up the days listed below:
The fundamental idea behind inventory forecasting is to estimate how much of your products you'll need to meet demand based on past demand. First, compile historical sales information; two years is preferable, but six months is the minimum if it's a new product. As you assess other elements that can impact future sales, figure out the average quantity you require and keep an eye out for seasonal trends. Do you, for instance, currently run a marketing campaign that could boost sales?

For inventory forecasting, there are four fundamental methods you might take into account.
Trend forecasting: Use variations in your product's demand over time to project potential trends. Occasionally, seasonality or other anomalies in historical sales data are not taken into consideration.
Visual forecasting: By charting historical data, you can spot trends and add skewed trend lines to uncover potential insights that you might have overlooked otherwise.
Qualitative forecasting: Market research and focus groups are typically used in qualitative forecasting. From this kind of data, forecasters then develop their models.
Quantitative forecasting: This method predicts future demand by utilizing historical numerical data. The forecast is typically more accurate the more data that is collected.
The amount of inventory your business need on hand can be projected using a variety of methods and equations. Among the basic formulas to take into account are lead time, which tells you how long it will take to receive new products or component parts after an order is placed, safety stock, which guarantees you have enough on hand to cover need if you run out and need to order more, and reorder point.
Regarding inventory forecasting, a crystal ball does not exist. Demand estimation is ultimately just that - an estimate, even with the greatest techniques available. But if you keep an eye on stock counts, inventory turnover, and other customer order trends, you'll be able to make more accurate long- and short-term plans.
Check out WorldCraft Logistics if you're looking for a 3PL that will assist you with inventory control and demand forecasting. You can effortlessly connect all the online stores you operate to your inventory in our warehouses for a flawless e-commerce fulfillment experience, thanks to WorldCraft Logistics's thousands of satisfied customers, integrated technology, fulfillment services, and e-commerce warehouses.

SEO
Digital Marketing/SEO Specialist
Simon Mang is an SEO and Digital Marketing expert at Wordcraft Logistics. With many years of experience in the field of digital marketing, he has shaped and built strategies to effectively promote Wordcraft Logistics' online presence. With a deep understanding of the logistics industry, I have shared more than 500 specialized articles on many different topics.

Education
02/18/2025
Education
01/05/2025

Education
01/01/2024
Education
09/09/2025
Education
08/28/2024