09/17/2025
Are you struggling to understand logistic regression and how it applies to real business problems? Many logistics and supply chain professionals hear the term but feel uncertain about what it means, when to use it, and how it can improve operations. This guide explains logistic regression in simple terms, from the formula to real-world applications like predicting on-time deliveries, classifying carrier performance, and reducing damage risks. Whether you are a manager, analyst, or student, you will learn how logistic regression works, why it matters, and how to apply it to logistics decision-making.
Logistic regression is a statistical model used to predict the probability that an event will occur, based on one or more independent variables. Unlike linear regression, which estimates continuous values, logistic regression is specifically designed for classification problems where the outcome is categorical such as yes/no, success/failure, or on-time/late delivery.
In logistics and supply chain management, logistic regression helps analysts determine whether a shipment will be delayed, whether a product will be damaged, or whether a customer is likely to churn. These binary or categorical outcomes make the logistic regression model especially powerful in real-world business applications.
At its core, logistic regression transforms input variables into a probability score using the logistic function, also known as the sigmoid function. This function maps any real number into a range between 0 and 1, which is ideal for probability estimation.
The general formula of logistic regression is:
P(Y=1∣X)=1+e−(β0+β1X1+β2X2+...+βnXn)1
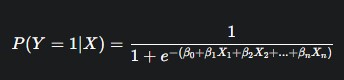
Where:
P(Y = 1 | X) = probability that the dependent variable equals 1 (for example, shipment is late).
β0 = intercept.
β1, β2, …, βn = coefficients of the independent variables.
X1, X2, …, Xn = independent variables (e.g., distance, weight, weekday, weather).
Imagine a logistics company wants to predict whether a package will be delivered on time (Y = 1) or late (Y = 0). The dataset includes two variables:
X1: delivery distance (in kilometers)
X2: shipment weight (in kilograms)
Suppose the logistic regression model is trained and produces the following equation:
P(Y = 1 | X) = 1 / (1 + e^-(2.5 - 0.01X1 - 0.05X2))
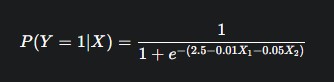
For a delivery 100 km away with a 10 kg package:
P(Y = 1 | X) = 1 / (1 + e^-(2.5 - 1 - 0.5))
P(Y = 1 | X) = 1 / (1 + e^-1.0)
P(Y = 1 | X) ≈ 0.73
This means there is a 73% probability that the package will arrive on time.
Logistic regression is not just a mathematical tool; it is a practical method that allows logistics and supply chain professionals to make better business decisions. By converting complex operational data into clear probabilities, a logistic regression model makes it possible to evaluate risks, allocate resources efficiently, and predict outcomes that directly affect service levels and costs.

One of the main advantages of logistic regression is its simplicity. The model is easy to interpret, even for managers who are not data scientists. For example, a logistic regression equation can show how much the distance of delivery increases the likelihood of a shipment being late. This level of clarity makes the method highly attractive in logistics operations, where managers must make quick and accurate decisions.
Logistic regression is computationally efficient. It can process large volumes of supply chain data such as order records, carrier performance, or warehouse transactions much faster than more complex machine learning algorithms. This speed allows businesses to deploy logistic regression analysis in real time for tasks like route planning or shipment delay detection.
The logistic regression model can handle different types of outcomes. Whether the question is binary (on-time vs late), multinomial (choosing between several carriers), or ordinal (ranking delivery priority levels), logistic regression provides a flexible solution. This adaptability is critical in logistics, where decisions often involve more than two possible outcomes.
Unlike many “black-box” machine learning methods, logistic regression provides clear visibility into how each independent variable influences the result. Coefficients in the logistic regression model can be directly translated into odds ratios, showing exactly how variables such as distance, shipment weight, or time of day affect delivery success. This transparency builds trust among stakeholders and ensures that decision-makers can rely on the analysis to improve logistics performance.
Logistic regression and linear regression are often compared because they are both fundamental statistical models. However, they serve different purposes. Understanding the differences is crucial for choosing the right model in logistics, where the type of prediction determines the quality of decisions.
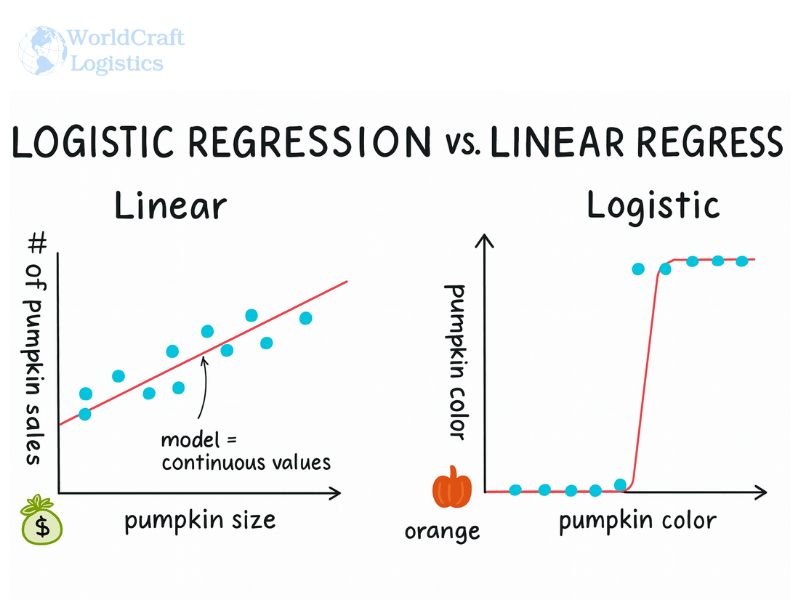
Linear Regression predicts a continuous outcome. It answers questions such as “What will the average delivery time be?” or “What is the expected fuel consumption for a route?”.
Logistic Regression predicts a categorical outcome. It answers questions like “Will the shipment be on time or late?” or “Will the package arrive damaged or intact?”.
Linear Regression Equation
Y = β0 + β1X1 + β2X2 + ... + βnXn + ε
Here, Y is continuous, such as delivery time in hours.
Logistic Regression Equation
P(Y = 1 | X) = 1 / (1 + e^-(β0 + β1X1 + β2X2 + ... + βnXn))
Here, P(Y = 1 | X) is the probability of a binary outcome, such as shipment arriving on time (1) vs late (0).
Linear Regression Example: A logistics analyst builds a model to predict delivery time (in hours) based on distance and weight. The result might show that each additional 50 km increases the delivery time by 1.2 hours.
Logistic Regression Example: The same analyst instead wants to know the probability of on-time delivery. The logistic regression model might show that every additional 50 km increases the probability of a late delivery by 8%.
Feature | Linear Regression | Logistic Regression |
Outcome Type | Continuous (e.g., hours, cost) | Categorical (e.g., on time vs late) |
Output | Numeric value | Probability between 0 and 1 |
Application in Logistics | Predict average delivery time, estimate transportation cost | Predict late shipments, classify damage risk |
Interpretability | Coefficients show how predictors affect the mean | Coefficients show how predictors affect the odds ratio |
The power of logistic regression lies in its ability to classify outcomes and assign probabilities, making it a versatile tool across multiple industries. By applying logistic regression analysis to different domains, businesses can uncover hidden patterns in data and make evidence-based decisions.
In manufacturing, logistic regression models are used to predict product defects and machine failures. For example, by analyzing variables such as production speed, temperature, and material type, the model can estimate the probability that a unit will fail a quality check. This helps reduce waste and improve efficiency on the production floor.
Logistic regression is widely used in healthcare to classify patient outcomes. Hospitals use logistic regression analysis to predict the likelihood of disease, patient recovery, or readmission rates. For instance, logistic regression models can analyze patient age, medical history, and test results to calculate the probability of complications after surgery.
Financial institutions apply logistic regression to credit risk modeling and fraud detection. A logistic regression model can classify whether a customer is likely to default on a loan based on factors such as income, debt-to-income ratio, and credit history. Similarly, logistic regression can flag potentially fraudulent transactions by analyzing unusual spending patterns.
In marketing, logistic regression is used to predict customer churn and response to campaigns. For example, logistic regression analysis can estimate the probability that a customer will stop using a subscription service, based on their purchase frequency, engagement levels, and demographics. This allows marketers to target retention campaigns more effectively.
Logistic regression has a particularly strong role in logistics. Some practical use cases include:
Predicting whether a shipment will arrive on time or be delayed.
Estimating the probability of damaged goods based on packaging, distance, or carrier.
Classifying customers by likelihood of repeat purchases for better demand forecasting.
Selecting the most reliable carrier by comparing probabilities of successful deliveries.
These examples highlight that logistic regression is not only a theoretical model but also a real-world decision-making tool that directly influences business outcomes.
Implementing a logistic regression model follows a structured process. Each step ensures that the analysis produces accurate predictions and actionable insights. Below is a framework that applies to most industries, with logistics examples included for clarity.
The first step is identifying the outcome you want to predict. In logistics, this might be:
Will a shipment arrive on time (1) or late (0)?
Which carrier is most likely to deliver successfully?
What is the probability of a package being damaged?
Clearly defining the dependent variable sets the stage for a reliable logistic regression analysis.
Logistic regression requires a dataset of past events with both independent variables (predictors) and outcomes. Examples of predictors in logistics include:
Distance traveled
Shipment weight
Weather conditions
Carrier performance history
Day of the week or seasonality
Data cleaning is critical at this stage. Missing values, extreme outliers, or inconsistent entries can lead to poor model performance.
Once data is prepared, the logistic regression model is fitted to the data. The training process estimates coefficients (β values) that describe how each predictor influences the log odds of the outcome.
Example: A coefficient of -0.02 for distance means that for every additional kilometer, the odds of on-time delivery decrease slightly.
After training, the model must be evaluated to ensure accuracy. Common evaluation methods include:
Confusion Matrix: Shows correct vs incorrect classifications.
Accuracy, Precision, Recall: Measures performance across categories.
ROC Curve and AUC: Assess the ability of the model to distinguish between outcomes.
Logistics Example: A model may achieve 85% accuracy in predicting late shipments, but if recall for “late” is only 50%, managers risk underestimating delays.
With a validated model, predictions can be made on new data. For example, a company can enter details of an upcoming shipment distance, weight, and carrier and the logistic regression analysis might output a 70% probability of being on time. This insight can guide proactive decisions, such as assigning a more reliable carrier.
A logistic regression model works by estimating the probability of a binary or categorical outcome based on one or more predictor variables. Instead of fitting a straight line, as in linear regression, the logistic regression model applies a mathematical function that outputs values between 0 and 1. These values can be interpreted as probabilities, making the model well-suited for classification tasks in logistics and beyond.
The logistic regression equation is written as:
P(Y = 1 | X) = 1 / (1 + e^-(β0 + β1X1 + β2X2 + ... + βnXn))
Where:
P(Y = 1 | X) is the probability of the event occurring (for example, delivery on time).
β0 is the intercept.
β1, β2, …, βn are the coefficients of the predictor variables.
X1, X2, …, Xn are the predictor variables, such as distance, weight, or carrier performance.
The independent variables represent features that influence the outcome. In logistics, these might include:
Distance (longer distances often increase the chance of delay).
Shipment weight (heavier packages may take longer to handle).
Day of the week (deliveries scheduled before weekends may face higher risk of delays).
Carrier history (reliable carriers have lower odds of failure).
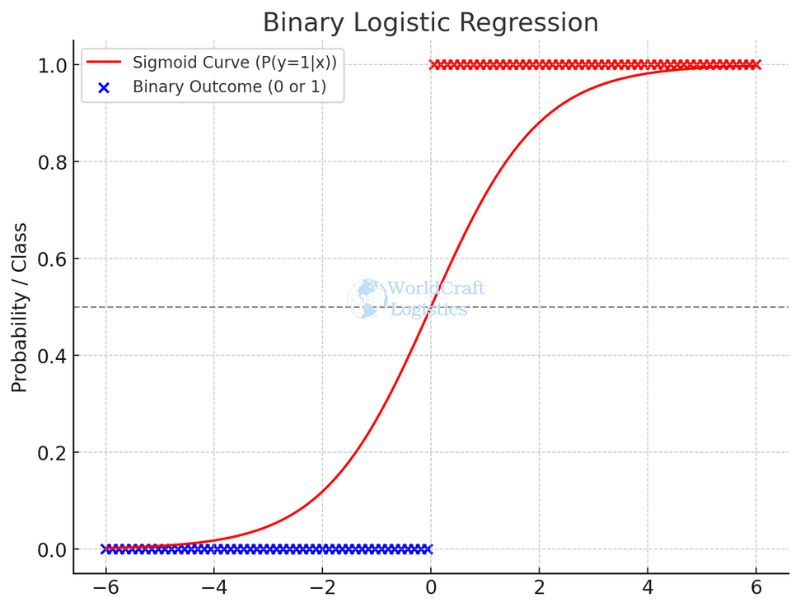
The logistic regression function uses the sigmoid curve to map results to a probability scale between 0 and 1. For example:
If the result of the equation is 0.9, the model predicts a 90% chance of an on-time delivery.
If the result is 0.2, the probability of on-time delivery drops to 20%.
This probability output is what makes the logistic regression model easy to interpret and apply in decision-making.
In real-world logistics, outcomes depend on more than one factor. Logistic regression analysis can easily include multiple independent variables. For example:
P(Y = 1 | X) = 1 / (1 + e^-(3.0 - 0.02Distance - 0.04Weight + 0.5*CarrierReliability)))
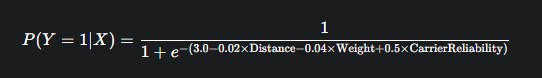
Distance = 200 km
Weight = 20 kg
CarrierReliability = 1 (if carrier is high-performing, 0 otherwise)
Substituting values:
P(Y = 1 | X) = 1 / (1 + e^-(3.0 - 4 - 0.8 + 0.5)))
P(Y = 1 | X) = 1 / (1 + e^(-1.3))
P(Y = 1 | X) ≈ 0.79
This means there is a 79% probability the shipment will be delivered on time.
The coefficients in a logistic regression model are often explained through the log of odds ratio. A positive coefficient increases the log odds (and therefore the probability), while a negative coefficient decreases it. For example, if the coefficient for CarrierReliability is +0.5, this indicates that using a reliable carrier increases the odds of on-time delivery compared to unreliable carriers.
Logistic regression is not limited to simple yes/no outcomes. Depending on the type of dependent variable, there are several forms of logistic regression analysis. Each type is designed for a specific category of classification problems, making logistic regression a flexible tool across industries, especially in logistics and supply chain management.
Binary logistic regression is the most common form, where the dependent variable has two possible outcomes.
General Example: predicting whether an email is spam or not spam.
Logistics Example: estimating the probability that a shipment will arrive on time (1) or late (0).
This type of logistic regression is ideal when the business question requires a clear yes/no classification.

Multinomial logistic regression is used when the dependent variable has more than two categories without any natural order.
General Example: predicting which product category a customer will choose.
Logistics Example: classifying which carrier will be selected among Carrier A, Carrier B, or Carrier C.
This type is helpful when analyzing situations with multiple outcomes, such as route choices or mode of transport.
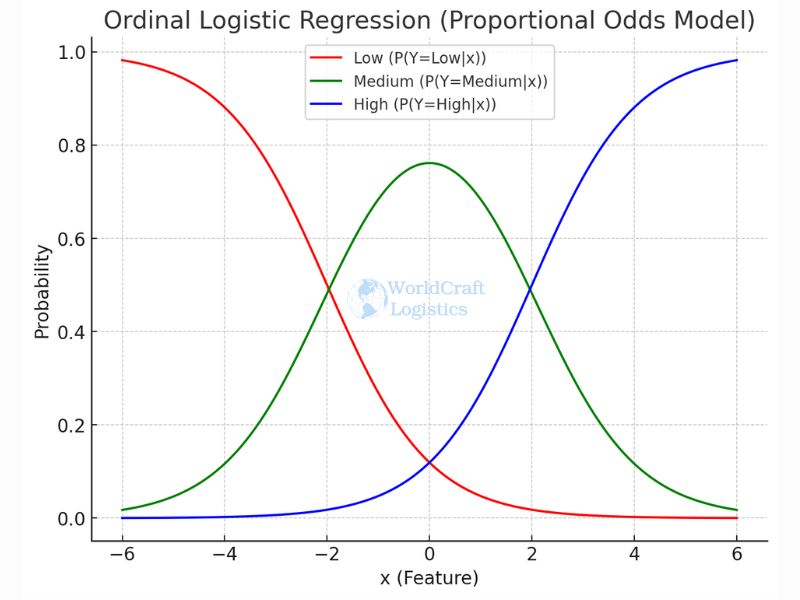
Ordinal logistic regression applies when the dependent variable has more than two categories with a meaningful order.
General Example: predicting customer satisfaction as low, medium, or high.
Logistics Example: rating damage severity during shipment as minor, moderate, or severe.
This type of logistic regression is valuable in supply chains where outcomes are ranked rather than distinct categories.
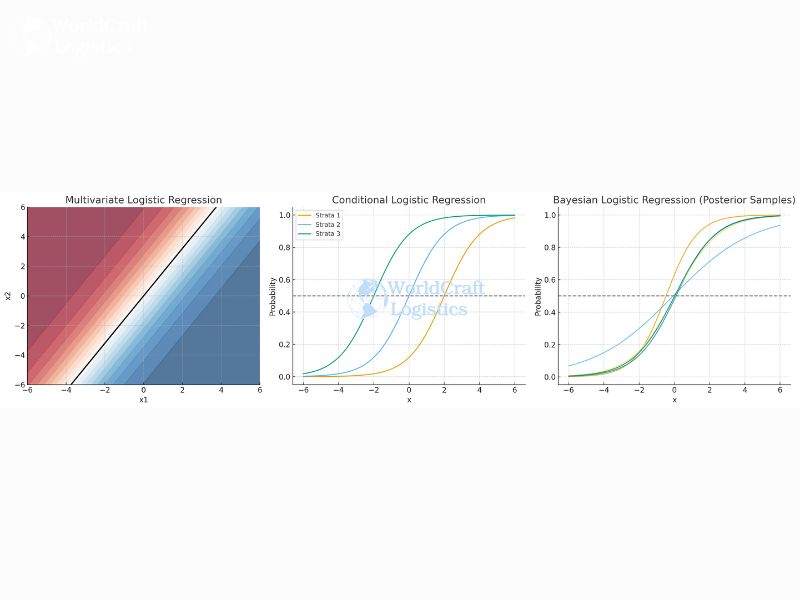
Beyond the three main types, there are advanced methods tailored to specific cases:
Multivariate Logistic Regression: when multiple dependent outcomes are modeled simultaneously.
Conditional Logistic Regression: often used in matched case-control studies, such as analyzing accident risk in transportation.
Bayesian Logistic Regression: integrates prior knowledge, useful when logistics data is sparse but expert insights are available.
Like any statistical technique, logistic regression is built on a set of assumptions. When these assumptions are met, the logistic regression model produces reliable results. When they are ignored, the analysis may lead to biased or misleading conclusions. For logistics and supply chain professionals, understanding these assumptions ensures that predictions about delivery times, carrier performance, or inventory outcomes remain accurate.
Logistic regression assumes a linear relationship between the independent variables and the log odds of the dependent variable. This does not mean the predictors themselves must be linear, but rather that the logit transformation of the outcome aligns linearly with predictors.
Logistics Example: The distance traveled should have a consistent effect on the log odds of a shipment being late. If very long distances have non-linear effects (e.g., a sudden jump in delays after 800 km), a transformation or interaction term may be necessary.
Each observation in the dataset should be independent. In practice, this means that the outcome of one shipment should not directly affect another in the model.
Logistics Example: If shipments are grouped by the same truckload or route, their outcomes may be correlated. In this case, clustered or hierarchical logistic regression methods should be considered.
Independent variables should not be too highly correlated with each other. Severe multicollinearity makes it difficult to estimate the unique effect of each variable.
Logistics Example: Suppose both “distance” and “fuel cost” are included in the model. Since fuel cost usually scales with distance, they may introduce multicollinearity. To resolve this, analysts might remove one of the variables or create a combined metric.
Logistic regression works best with a sufficiently large dataset. Small samples can lead to unstable coefficient estimates and unreliable predictions.
Logistics Example: A model built on only 50 delivery records will not be as reliable as one trained on 5,000. Larger samples provide more stable estimates of how predictors influence delivery success.
While logistic regression is one of the most widely used classification methods, it is not the only option. Other machine learning techniques, such as decision trees, random forests, and deep learning, often compete with logistic regression in predictive modeling. Understanding where logistic regression stands in comparison helps logistics professionals choose the right tool for the job.
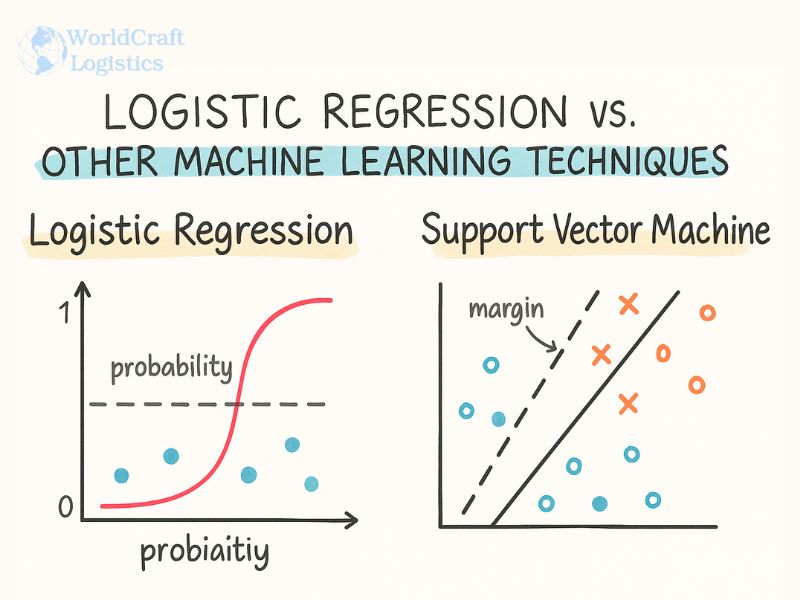
Logistic Regression assumes a linear relationship between predictors and the log odds of the outcome. It works best when the relationship between variables is relatively straightforward.
Decision Trees split the dataset into smaller groups based on conditions, such as “distance > 200 km” or “shipment weight < 10 kg.” They capture non-linear relationships naturally.
Logistics Example:
Logistic regression might calculate the probability of a package arriving late based on distance and carrier reliability.
A decision tree, however, could reveal rules such as: “If distance > 200 km and carrier reliability = low, then probability of delay = 90%.”
Decision trees are easier to interpret for rule-based insights, but logistic regression remains more statistically grounded and stable when datasets are large.
Random Forests are ensembles of decision trees that improve accuracy by reducing overfitting.
Logistic regression, while simpler, provides coefficients and odds ratios that are easier to interpret.
Logistics Example: A random forest model may achieve higher accuracy in predicting shipment delays, but logistic regression can explain why delays happen, making it more actionable for managers.
Deep Learning uses neural networks with multiple layers to detect complex patterns in very large datasets. It excels in image recognition, natural language processing, and unstructured data.
Logistic regression, by contrast, is lightweight, explainable, and requires fewer computational resources.
Logistics Example:
Logistic regression could predict whether a shipment is on time or late using structured tabular data such as distance, weight, and carrier.
A deep learning model could analyze satellite images or traffic camera feeds to detect real-time risk of delays.
While deep learning offers higher predictive power for unstructured data, logistic regression is often preferred in logistics because it is fast, interpretable, and cost-effective.
Use logistic regression when you need clear explanations, quick deployment, and actionable
Use decision trees or random forests when relationships between variables are complex and non-linear.
Use deep learning when working with very large datasets or unstructured data, such as images, GPS streams, or IoT sensor inputs.
Building a logistic regression model is only the first step. To ensure that predictions are accurate and trustworthy, the model must be carefully evaluated. Model evaluation highlights how well the logistic regression analysis distinguishes between outcomes, such as whether a shipment will arrive on time or be delayed.
A confusion matrix is a table that compares the model’s predicted classifications with the actual outcomes. It contains four key values:
True Positives (TP): Correctly predicted late shipments.
True Negatives (TN): Correctly predicted on-time shipments.
False Positives (FP): Shipments predicted to be late but were actually on time.
False Negatives (FN): Shipments predicted to be on time but were actually late.
Logistics Example: Out of 1,000 shipments, the model might correctly predict 800 on-time deliveries (TN) and 120 late deliveries (TP), while misclassifying 50 (FP) and 30 (FN).
Accuracy: (TP + TN) / Total Predictions. Measures overall correctness.
Precision: TP / (TP + FP). Indicates how many predicted delays were true delays.
Recall (Sensitivity): TP / (TP + FN). Shows how well the model detects actual delays.
Logistics Example: If a model has high accuracy but low recall, it may miss many late shipments, an unacceptable risk in supply chain operations.
The Receiver Operating Characteristic (ROC) curve plots the trade-off between the true positive rate and false positive rate. The Area Under the Curve (AUC) is a single metric summarizing this trade-off.
AUC close to 1.0: Excellent model performance.
AUC near 0.5: Model is no better than random guessing.
Logistics Example: A logistic regression model predicting carrier delays with an AUC of 0.87 provides strong evidence that it reliably distinguishes between reliable and unreliable carriers.
Beyond classification, it is important that predicted probabilities are well-calibrated. For example, if the model predicts a 70% chance of late delivery, then roughly 70 out of 100 such shipments should indeed be late. Poor calibration can lead to overconfidence or underestimation of risks.
Logistic regression can be implemented in a variety of software tools, from programming languages to business-oriented platforms. The choice of tool depends on the user’s technical background, data size, and application needs. Below are the most common options for running logistic regression models, along with logistics-specific examples.
Python is one of the most popular languages for data analysis. Libraries such as scikit-learn and statsmodels make it easy to build and evaluate logistic regression models.
Example: A logistics analyst can use scikit-learn to predict whether a shipment will arrive late, using features like distance, shipment weight, and carrier reliability. Python also allows integration with real-time tracking systems for automated decision-making.
R is widely used in academic and research settings for statistical modeling. Functions like glm() and packages such as caret or net allow users to fit logistic regression models with advanced customization.
Example: A supply chain researcher might use R to test multiple logistic regression models that predict warehouse stockout probabilities, then compare model performance across regions.
For non-technical users, Excel provides logistic regression functionality through add-ins or built-in data analysis tools. While less powerful than Python or R, Excel is accessible to many business professionals.
Example: A logistics manager can use Excel to estimate the probability of a delivery delay based on distance and carrier performance, without requiring advanced programming knowledge.
SPSS is often used in the social sciences and business analytics for its user-friendly interface. Logistic regression can be performed via menus, making it suitable for non-programmers.
Example: A logistics company could use SPSS to model customer churn probabilities in its delivery subscription services.
Stata is another powerful statistical tool, particularly in econometrics. Logistic regression in Stata is efficient for handling large datasets and advanced statistical tests.
Example: Transportation economists can use Stata to study the effect of fuel prices and distance on the probability of delayed freight deliveries.
Cloud-based platforms allow logistic regression models to be trained and deployed at scale. Services like Amazon SageMaker, Google Vertex AI, or Azure Machine Learning support end-to-end workflows.
Example: A logistics provider can deploy a logistic regression model on AWS to automatically predict late shipments in real time, based on streaming GPS and IoT sensor data.
A logistic regression model is used to predict the probability of a categorical outcome. In logistics, this means estimating whether a shipment will be late, whether a product will be damaged, or which carrier will deliver most reliably. The model is valuable because it outputs probabilities between 0 and 1, which can be directly applied to decision-making.
The main assumptions include linearity in the logit, independence of observations, no multicollinearity between predictors, and a sufficiently large sample size. Meeting these assumptions ensures that the logistic regression model produces accurate results.
Standardization is not always required, but it can improve model performance when independent variables have very different scales. For example, if one variable is measured in kilometers and another in minutes, scaling them helps the logistic regression model converge more quickly and improves coefficient interpretability.
Yes, logistic regression can be implemented in Excel through the Data Analysis ToolPak or third-party add-ins. However, for more advanced use cases, tools such as Python, R, or SPSS are recommended.
Online logistic regression calculators can provide quick estimates, but their reliability depends on the quality of the input data. For professional logistics applications, it is better to use full-featured statistical software that allows proper evaluation of model assumptions and accuracy.
Linear regression predicts continuous values, such as delivery times or costs. Logistic regression predicts categorical outcomes, such as on-time vs late deliveries. Logistic regression is the better choice whenever the business problem requires classification.
Logistic regression may seem intimidating at first, but it is one of the most practical and reliable tools for making data-driven decisions. By converting complex variables into clear probabilities, a logistic regression model helps logistics and supply chain professionals predict late deliveries, assess carrier reliability, and reduce operational risks. The message is clear: understanding and using logistic regression is not optionality is essential for staying competitive in today’s data-driven logistics environment.

SEO
Digital Marketing/SEO Specialist
Simon Mang is an SEO and Digital Marketing expert at Wordcraft Logistics. With many years of experience in the field of digital marketing, he has shaped and built strategies to effectively promote Wordcraft Logistics' online presence. With a deep understanding of the logistics industry, I have shared more than 500 specialized articles on many different topics.

Education
02/18/2025

Education
01/05/2025
Education
01/01/2024
Education
09/09/2025
Education
08/28/2024