04/16/2026
The United States Bureau of Labor Statistics recently unveiled critical data regarding international trade costs. For logistics professionals and global shippers, understanding these macroeconomic shifts is vital for strategic planning. To access the original comprehensive data tables directly, you can view the PDF file issued by the authoritative government source.
The latest statistical figures highlight significant momentum across both incoming and outgoing commodity markets. The dynamics of these pricing adjustments ripple directly into global freight operations and carrier pricing models.
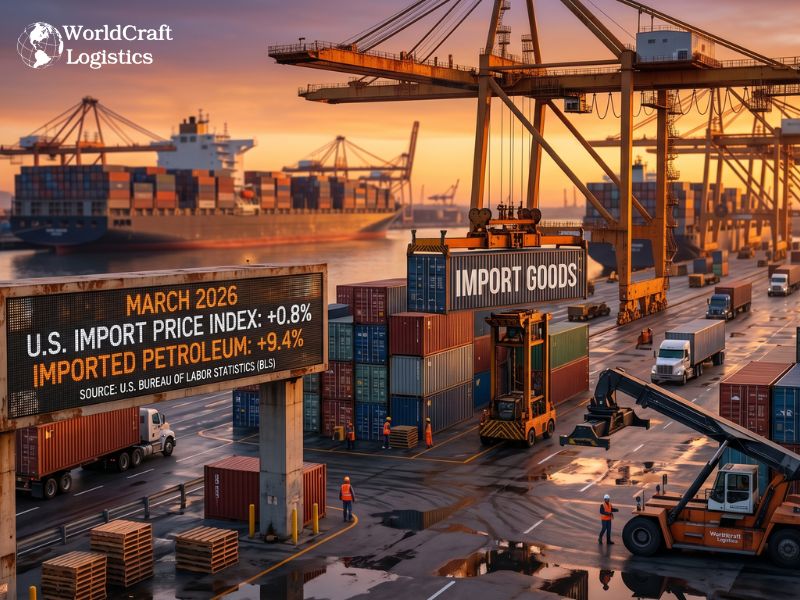
In March 2026, overall US import prices increased by 0.8 percent, which followed a 0.9 percent rise during the previous month. When evaluating the broader economic timeline, prices for imported goods advanced 2.1 percent over the past 12 months. This represents the most substantial over the year advance since December 2024. Higher costs for nonfuel industrial supplies, capital goods, and consumer materials were major contributors to this steady inflation.
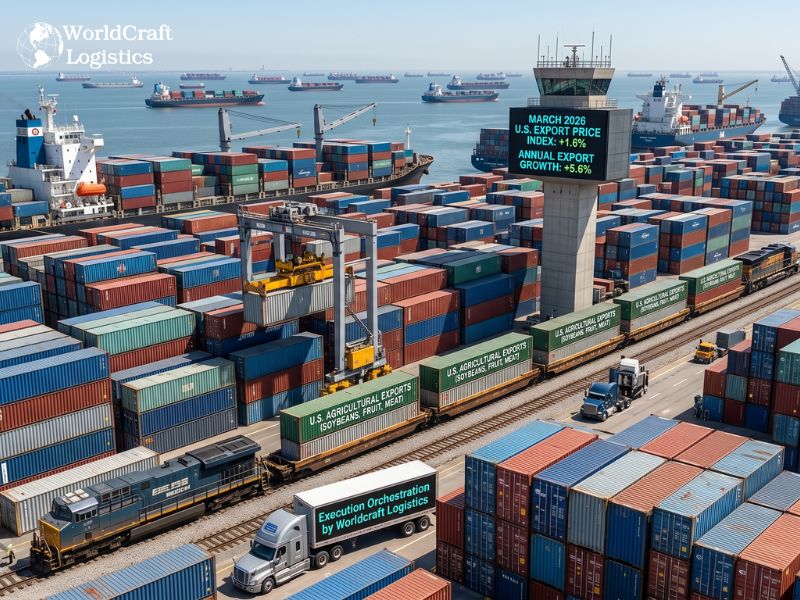
The momentum was even stronger on the outbound side. Prices for US exports rose 1.6 percent in March. This pushed the 12 month export price increase to a staggering 5.6 percent, marking the largest annual surge since November 2022. Both agricultural and nonagricultural exports saw price hikes, with agricultural commodities rising by 0.9 percent, driven heavily by soybeans, fruit, and meat.
Energy costs remain a volatile component of international trade economics. The March 2026 report highlights significant variations within the energy sector, fundamentally altering operational budgets for international shippers.
Import prices for fuels and lubricants increased 2.9 percent in March. Interestingly, this average masks a sharp divergence between different energy sources. Imported petroleum and petroleum products advanced by a sharp 9.4 percent in a single month. Conversely, natural gas import prices plummeted by an astonishing 71.0 percent following steep increases in previous months.
Such massive fluctuations often dictate carrier fuel surcharges and overall shipping profitability. To understand how market reactions often misinterpret these shifts, explore our expert analysis on AI in Freight Logistics: Why the market selloff is overdone.
When commodity values rise and energy costs swing unpredictably, the pressure on global supply chains intensifies. Importers and exporters often rush to move goods ahead of anticipated price hikes, which can severely strain port infrastructure. If your shipments are experiencing uncharacteristic delays, we highly recommend reviewing the 10 Common Causes of Port Congestion in 2026 to optimize your routing strategies and mitigate demurrage risks.
The current economic landscape demands more than just traditional freight forwarding tactics. From an objective industry standpoint, the 5.6 percent annual surge in export prices combined with volatile petroleum costs will squeeze margins for unprepared shippers. The traditional approach of passively tracking shipments is obsolete when dealing with sudden macroeconomic shocks.
Logistics managers must pivot from passive monitoring to active, data-driven intervention. Organizations that fail to upgrade their technological infrastructure will struggle to absorb these rapid trade cost adjustments. For a deep dive into this necessary industry evolution, read Why supply chain visibility is failing in 2026 and the shift toward execution orchestration? to ensure your supply chain remains resilient.
Do not let rising import and export costs disrupt your business operations. Partner with a logistics provider that prioritizes visibility and execution. Reach out to Worldcraft Logistics for a comprehensive evaluation of your current freight strategy and discover how we can streamline your global shipments.

SEO
Digital Marketing/SEO Specialist
Simon Mang is an SEO and Digital Marketing expert at Wordcraft Logistics. With many years of experience in the field of digital marketing, he has shaped and built strategies to effectively promote Wordcraft Logistics' online presence. With a deep understanding of the logistics industry, I have shared more than 500 specialized articles on many different topics.

Hot News
08/05/2024

Hot News
02/23/2023

Hot News
02/23/2023

Hot News
02/06/2023

Hot News
02/07/2023